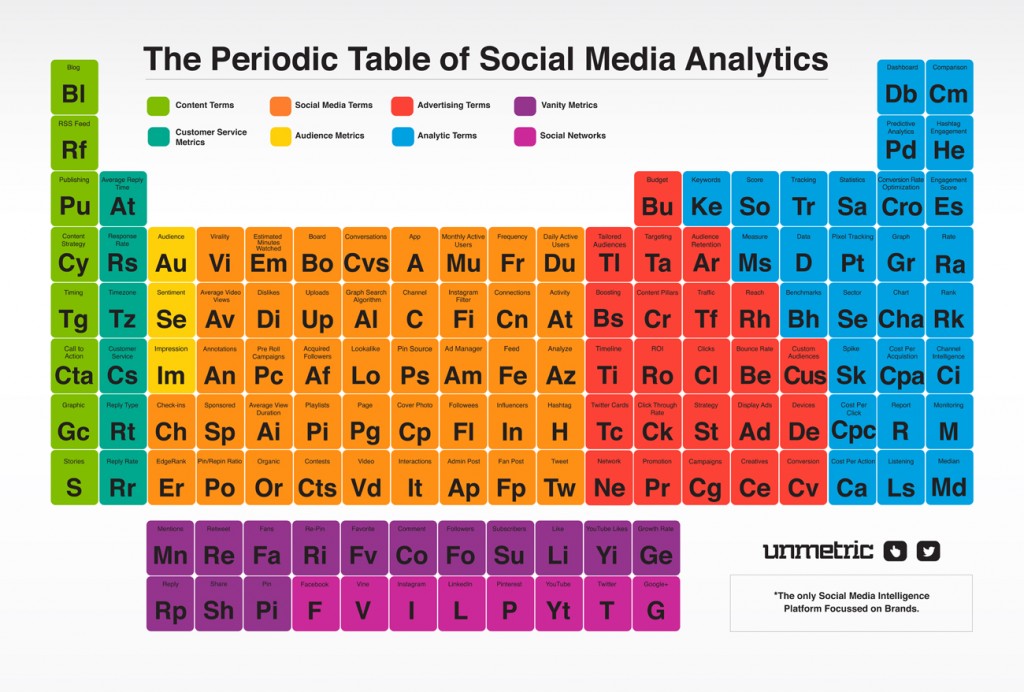
Too often we hear the common misconceptions that the efforts of social media marketing (and marketing in general) cannot be tracked. We hear that there’s no way to possibly calculate the impact of an ad campaign or a social post, when in reality there is a distinct methodology that encourages strategy, and measures results. There are several important metrics and calculations that can be utilized to determine your ROI, and optimize your marketing strategy. Sure, there will always be a level of gut instinct and creativity involved. Those things will forever be an integral part of any successful campaign. Nonetheless, there is still an underlying science to social media marketing. Hence, the creation of the Periodic Table of Social Media Analytics brought to you by Unmetric. The table covers all of the important elements of social media marketing from key terms and vocabulary, to valuable tracking metrics. We thought we’d highlight a couple of the essential elements for all of the aspiring social media marketing scientists out there.
(Rs) Response Rate
Response rate is a measure of how many user posts and messages your brand responds to. Time is also an important variable taken into account. How quickly you are able to respond to your messages and posts from users can make a huge difference in how your brand is perceived. Habitually failing to respond to your followers fast enough, or even failing to respond at all, could mean a loss of followers and ultimately a loss of potential customers. This is precisely why your response rate is an important customer service metric to be monitoring and maintaining. An acceptable response rate falls between 9 to 10 hours after a user’s original post and ideally you should be shooting to respond to 100% of user inquiries. Should your response times spike above 9 to 10 hours, you may have some unhappy followers. However, if you’re having trouble keeping your rate at an acceptable level you’re not the only one. Studies show that brands have had a significant amount of trouble responding to an increasing level of user engagement. 2014 data reveals that Facebook business pages have had an average response rate of 42.4%. This means that 57.6% of user questions are being neglected. Your brand should certainly strive to be above average.
(Gc) Graphic
We live in a visual world and this is a fact that is reflected in social media interaction. Social posts with pictures on average receive 39% more user interactions. Posts with photos tend to receive 53% more likes, 104% more comments, and 84% more click-throughs than their text-based counterparts. All of this data points to the fact that graphics are important for your content. You should strive to find or create images that are visually appealing enough to catch the eyes of your audience and entice them to interact. If you’re struggling to find the right pictures for your post you may want to take a look at these 15 websites provided by Jeff Bullas to find free images for you content.
(Ge) Growth Rate
Social media growth rate is a measure of how many fans you’re gaining within a given time frame. Growth rates are typically assessed on a weekly basis. The average growth rate for Facebook pages falls at .64% per week. This means a fan page currently at 1,000 followers would expect to gain about 25 new followers per month. Is your growth rate lacking? Perhaps you should turn to your engagement score for answers.
(Es) Engagement Score
While every social media metric is useful, your engagement score is hands down the most important metric to track. An engagement score is a measure of the average number of likes, comments, and shares, per post that your page receives. Obviously, if your fans do not like what you’re posting then you have a problem and you need to switch up your marketing strategy, or risk losing followers. A drop in engagement rate could certainly result in a drop in growth rate and a drop in conversion rates as well. On the flip side, a high engagement rate is something worth noting. Find out which of your posts are receiving the highest responses and work to create similar content for the future. Wondering how to track your engagement score? Klout provides an engagement tracking service for all of your social media profiles and it’s completely free!
(Pr) Promotion
Your social media posts will never see the level of post reach you hope to obtain without a promotion budget. If you want to be seen on social media, then you have to spend some money. This is especially true now that Facebook has been limiting the organic reach of brand posts. The general rule is that you should spend anywhere from $0.2 to $1 per page like on a promoted post. If you don’t have the budget for that kind of promotion, that’s completely understandable. At the very least, you should spend $10 a week on post promotion. You’d be surprised at the results you can accomplish even on such a small budget.
We’ve covered just 5 crucial elements out of the 132 total elements. Every single element on the Periodic Table of Social Media Analytics plays an integral part in a successful social media marketing strategy. A lot can be said about each and every element. We just couldn’t fit all of that information into one blog post. Be sure to check back on our blog for more social media marketing news, tips, tricks, and information to come in the near future. What do you think about the periodic table? Are there any elements missing or is it an all encompassing table?